Building an AI Trading Bot — Week One: Why a 90 % Win Rate Can Still Lose Money

📊 Full opportunity report: Building an AI Trading Bot — Week One: Why a 90 % Win Rate Can Still Lose Money on ThorstenMeyerAI.com — validation score, market gap, and execution plan.

TL;DR

An AI-driven trading bot tested on simulated markets reports high win rates over 90%, but overall profitability remains elusive. The findings reveal that win rate alone is not a reliable indicator of trading edge.

A researcher has completed the first week of testing an AI-driven trading bot on simulated markets, revealing that strategies with over 90% win rates can still lose money overall.

The experiment involved running 21 variants of a trading bot on short-dated binary prediction markets for major cryptocurrencies. Despite several strategies showing win rates above 90%, the overall profitability was negative once market-implied probabilities were considered. The researcher emphasized that high win rates often result from taking trades when the market already favors an outcome, which skews the apparent success rates without indicating genuine edge.

One particular strategy, based on a fair-value approach, exhibited a below-50% win rate but achieved positive net profit over hundreds of trades. This suggests that strategies with asymmetric payoff profiles—accepting frequent small losses for larger wins—may hold real promise, though the sample size remains too small for definitive conclusions. The same model applied to different assets produced conflicting results, with some variants losing money at high confidence levels, underscoring the importance of market-specific factors.

Building an AI Trading Bot · Week One · The Win Rate Trap.
DISPATCH / PAPER TRADING RESEARCH AI TRADING BOT · WEEK ONE · WIN RATE TRAP · SIMULATED FUNDS
▲ NOT FINANCIAL ADVICE Paper trading · simulated funds only · research lab
Building an AI Trading Bot · Part 1 of an ongoing series

Week one.
Why a 90% win rate
can still lose money.

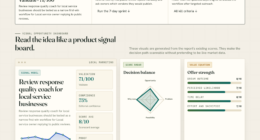
21 strategies running in parallel · 700+ settled paper trades · 18 of 21 with reasonable win rates · 2 variants at 100% wins. And almost none of it means what it looks like.

An experimental AI-driven trading bot running 21 strategy variants against 5-minute binary prediction markets on major crypto assets. Every trade is paper — simulated funds only. Headline numbers look extraordinary: 18 of 21 variants with reasonable win rates · entire fleet on one underlying with >90% wins · two specific variants at 100% wins over 38-44 settled trades. The data is telling a very different story than the leaderboard suggests. Most of the "winning" strategies are buying when the market has already priced one side at 90-95 cents on the dollar — the right baseline isn't 50%, it's the market-implied probability, and below 95% wins on that math is a slow bleed. One strategy — and only one — has the opposite signature: below-50% win rate, 2.5× average winning trade vs losing trade, meaningfully positive net P&L over several hundred settled positions. The right signature. The smoking-gun negative result: same code running on different assets is statistically significantly losing money. Same model, same parameters, different markets, different results — that's data you'd pay for.

!
▲ Not financial advice · simulated funds only · research lab
The bot described here trades exclusively with simulated money. Nothing in this article should be used to inform real trading decisions. If you build something similar and run it with real funds, you should fully expect to lose them — that is the most likely outcome, by a wide margin, regardless of what early numbers suggest. Prediction markets are zero-sum after fees, dominated by sophisticated participants, and structurally hostile to part-time retail strategies.
▲ The structural editorial finding · week one
Win rate is the wrong metric. P&L distribution and expected value are everything. A 95%-win strategy that loses 19× as much when it's wrong is a worse trade than a 45%-win strategy that pays 2× as much when it's right. The right null hypothesis is not "random" — it's "whatever the market is already pricing." A strategy that works equally well on everything is almost always a fluke; a strategy that works narrowly is doing something.
— building an ai trading bot · week one · the win rate trap · paper trading research lab
21
Strategy variants running in parallel · 4 strategy families × 4 underlyings · each on its own simulated bankroll
Real market data · real order books · real fees · real latency model · simulated funds only · research lab not wallet
700+
Settled paper trades across the fleet · enough to reject "obviously useless" · nowhere near enough to claim "real edge"
18 of 21 variants showing reasonable win rates · entire fleet on one underlying at >90% wins · 2 at 100% over 38-44 trades
1
Strategy with the right edge signature · <50% win rate · 2.5× win:loss ratio · meaningfully positive net P&L
Fair-value style model on most liquid underlying · candidate worth watching · sample still too small to call
99%
Confidence on cross-asset negative result · same code statistically significantly losing money on other underlyings
Same model · same parameters · same code path · different volatility regime + microstructure · different result · informative
90% WIN RATE TRAP SNIPER-STYLE VARIANTS · 19× LOSSES VS WINS · NET NEGATIVE P&L · MECHANICAL ILLUSION BASELINE IS NOT 50% MARKET-IMPLIED PROBABILITY IS THE RIGHT NULL · 95% PRICED IN = 95% NEEDED TO BREAK EVEN CANDIDATE SIGNATURE <50% WINS · 2.5× WIN:LOSS · MEANINGFULLY POSITIVE · ORDER OF MAGNITUDE MORE TRADES NEEDED CROSS-ASSET NEGATIVE SAME CODE, DIFFERENT MARKETS, DIFFERENT RESULTS · 99% CONFIDENCE NEGATIVE-EDGE ON ONE VARIANT RUN-TO-ZERO DRAWDOWN GATES DISABLED AS TEACHING EXERCISE · $300 BANKROLL EVAPORATED · INFORMATIVELY MOST STRATEGIES ARE FLAT-TO-LOSING · 1 OF 21 WORTH MORE INVESTIGATION · REST ARE ILLUSIONS, LOSERS, OR NOISE
The 90% win rate trap · asymmetric P&L · the math

90% wins. Still net negative.

Most of the "winning" strategies in the fleet are buying when the market has already decided one side is going to win. They wait until one outcome is priced around 90-95 cents on the dollar, then take the favorite. If the favorite holds, the trade pays a few cents. If it doesn't, the trade loses almost the entire bet. The asymmetry makes the high win rate structurally meaningless.

The asymmetric-P&L math · 90% wins ≠ profit
The 10 winning trades pay a few cents each. The 1 losing trade loses almost the entire bet. The right question is not "do you win more than half the time?" — it's "do you win at the rate the market is already pricing in?"
▲ Sniper-style variant · 90% wins
Mechanical illusion
10 trades × +$0.05 = +$0.50 won
1 trade × −$0.95 = −$0.95 lost
−$0.45 net11 trades · 90.9% win rate · negative P&L
▲ Candidate signature · <50% wins
Real edge
4 trades × +$2.50 = +$10.00 won
6 trades × −$1.00 = −$6.00 lost
+$4.00 net10 trades · 40% win rate · positive P&L
▲ The right baseline · market-implied probability, not coin-flip
If the market is pricing the favorite at 95% to win, you need to win at least 95% of those trades just to break even after the asymmetric payoff. Anything less than 95% is a slow bleed, regardless of how confident the percentages look. A high win rate, by itself, tells you almost nothing about whether a strategy has edge — it tells you about the kind of trades being taken, not the quality of the decisions.
The candidate signature · what real edge looks like
Use Claude to Build 7 AI Trading Bots: Stocks, Options, Crypto. The Multi-Strategy Playbook used for Backtesting and Live Trading (AI Trading Bot Series)

Use Claude to Build 7 AI Trading Bots: Stocks, Options, Crypto. The Multi-Strategy Playbook used for Backtesting and Live Trading (AI Trading Bot Series)

As an affiliate, we earn on qualifying purchases.

As an affiliate, we earn on qualifying purchases.

One candidate. Right signature.

After dismissing the high-win-rate experiments as mechanical illusions, the search shifted to the opposite signature — a strategy that loses more often than it wins but still makes money. That's the mathematical fingerprint of a real prediction signal: bigger wins than losses, willing to be wrong frequently in service of being right with conviction.

The candidate signature · <50% wins, 2.5× win:loss, net positive
Fair-value style model on the most liquid underlying. One strategy in the fleet — and currently only one — looks like a real edge signature. Sample still too small to call. Running for at least an order of magnitude more trades before claiming more than "candidate worth watching."
▲ Win rate
<50%
Wrong more often than right. Willing to lose frequently in service of being right with conviction — the mathematical fingerprint of real edge.
▲ Win:loss ratio
2.5×
Average winning trade is roughly 2.5× average losing trade. Asymmetric P&L on the right side — bigger wins than losses produces positive expected value at <50% accuracy.
▲ Net P&L
+
Meaningfully positive over several hundred settled positions. Fair-value style model not momentum/favorite-rider · most liquid underlying · the right edge signature.
▲ The caveat · sample still too small to call
A few hundred settled trades is enough to reject "obviously useless" — it is nowhere near enough to confidently claim "this is real edge that will persist." A favorable variance window of the right length can produce numbers that look exactly like this without any underlying skill at all. Running for at least an order of magnitude more trades before claiming more than "this is the candidate worth watching."
Cross-asset negative result · the smoking gun
Amazon

cryptocurrency trading simulation platform

As an affiliate, we earn on qualifying purchases.

As an affiliate, we earn on qualifying purchases.

Same code. Different markets.

The strongest evidence that the candidate strategy might be real comes from an unexpected place: running the exact same code on different assets produces statistically significant losses. Same model, same parameters, same code path, different volatility regime, different microstructure, different result.

Cross-asset negative result · same model, different outcomes
A strategy that works equally well on everything is almost always a fluke. A strategy that works on one specific market structure and fails on others is doing something. The cross-asset variants ran themselves down toward zero, generating clean evidence the underlying model is not universal.
▲ Underlying 1
Most liquid
+ Positive
Meaningfully positive net P&L. Candidate signature. <50% wins · 2.5× win:loss · several hundred trades.
▲ Underlying 2
Cross-asset
− Negative
Statistically significantly losing. Same model · same parameters · different volatility regime.
▲ Underlying 3
Cross-asset
− Negative
99% confidence negative-edge. Same code path · different microstructure · ran itself down toward zero.
▲ Underlying 4
Cross-asset
− Negative
Bankroll evaporated. Risk gates disabled as teaching exercise · $300 simulated bankroll · informatively.
▲ The structural finding · informative in a way "everything's green" never is
The cross-asset variants ran themselves down toward zero, generating clean evidence the underlying model is not universal — that's data you'd pay for. Instead it came from a $300 simulated bankroll evaporating in an interesting way. The negative result is the structural evidence that the candidate strategy might be doing something real — narrow applicability is a feature, not a bug.
Week one lessons · plain language · five bullets
Algorithmic Trading with Python: Build, Backtest, and Automate Strategies with Code, Data, and Real-World Market Tools

Algorithmic Trading with Python: Build, Backtest, and Automate Strategies with Code, Data, and Real-World Market Tools

As an affiliate, we earn on qualifying purchases.

As an affiliate, we earn on qualifying purchases.

Five lessons. Plain language.

What week one actually taught. The lessons are not novel to anyone who has spent serious time on systematic trading — but you don't internalize them until you watch them happen on your own paper bankroll. Out of 21 variants, one candidate worth more investigation. The ratio is roughly what was expected going in.

Five lessons crystallized · the week one observation set
Most strategies will be flat-to-losing. 1 of 21 candidate worth more investigation · the rest are either mechanical illusions, statistically-confirmed losers, or too noisy to tell apart from random. That ratio is roughly what was expected going in.
01
Win rate is the wrong metric. P&L distribution and expected value are everything. A 95%-win strategy that loses 19× as much when it's wrong is a worse trade than a 45%-win strategy that pays 2× as much when it's right.
02
The right null hypothesis is not "random." It's "whatever the market is already pricing." If your strategy isn't beating that, you don't have an edge — you have a confusing way to copy the consensus.
03
Run the same strategy on multiple markets before believing it works. If it falls apart when you change the underlying, it might be real and narrowly applicable. If it works on everything, it's almost certainly variance.
04
Disable risk gates only as a teaching exercise. Several experiments hit their drawdown limits, gates were loosened, they tripped again, gates were disabled entirely, they ran to zero. That run-to-zero was extremely informative. Doing the same thing with real money would have been a disaster.
05
Most strategies will be flat-to-losing. Out of 21 variants, 1 candidate worth more investigation. The rest are illusions, statistically-confirmed losers, or too noisy to tell apart from random. That ratio is roughly what was expected going in — but you don't internalize it until you watch it happen.

Win rate lies. Sample sizes lie. Most things that look like alpha are not. A high win rate, by itself, tells you almost nothing about whether a strategy has edge — it tells you about the kind of trades being taken, not the quality of the decisions. One strategy in the fleet has the right signature — <50% wins, 2.5× win:loss, meaningfully positive net P&L on the most liquid underlying. That's the candidate worth watching. Same code on different markets produces statistically significant losses — informative in a way "everything's green" never is. If you take this article as a reason to put money into anything, you have misread it.

— building an ai trading bot · week one · paper trading research · part 1 of an ongoing series · simulated funds only
The research lab · what's being measured
  • Underlying markets · 5-minute "Up or Down" binary prediction markets on major crypto assets
  • Strategy fleet · 21 variants in parallel · 4 strategy families × 4 underlyings
  • Bankroll model · each variant on its own simulated bankroll · isolated from the rest
  • Simulation fidelity · real market data · real order books · real fees · real latency model · simulated funds only
  • Sample size · 700+ settled trades across the fleet as of week one
  • Headline trap · 18 of 21 showing reasonable win rates · entire fleet on one underlying at >90% · 2 at 100% over 38-44 trades
  • Honest read · most of the "high win rate" variants are below the market's own implied 95% rate · slow bleed
  • Aggregate 16 sniper variants · net negative P&L despite 90% wins · 10% of losses are 19× the size of the wins
  • Candidate signature · <50% wins · 2.5× win:loss · positive net P&L · most liquid underlying · fair-value style
  • Sample caveat · several hundred trades enough to reject "useless" · nowhere near "real edge that will persist"
  • Cross-asset finding · same code statistically significantly losing on other underlyings · 99% confidence on one variant
  • Smoking-gun negative · strategy that works equally on everything = fluke · works narrowly = doing something
  • Run-to-zero · risk gates disabled as teaching exercise · $300 simulated bankroll evaporated · informative
  • Lesson 1 · win rate is the wrong metric · P&L distribution and expected value are everything
  • Lesson 2 · right null hypothesis is market-implied probability · not coin-flip
  • Lesson 3 · run same strategy on multiple markets before believing it works
  • Lesson 4 · disable risk gates only as teaching exercise · never with real money
  • Lesson 5 · most strategies will be flat-to-losing · 1 of 21 candidate worth more investigation
  • What's next · week 2 longer-horizon results on candidate · 100% win rate trap deep-dive · cross-asset and cross-regime analysis · replay testing
  • Trade secrets · cookbook stays out · findings come out · broadcasting the recipe would make whatever edge exists evaporate the moment anyone copied it
Colophon · AI trading bot series · Part 1 · week one

Set in Source Serif 4 (display), EB Garamond (essay body), IBM Plex Sans & IBM Plex Mono. AI Trading Bot research lab · Part 1 of an ongoing series · paper trading only · simulated funds only · the win-rate trap and what real edge actually looks like. Empirical-clay dominant register · labor-rose for the cautionary findings (trap, run-to-zero) · alternative-sage for the candidate-strategy positive signal · structural-slate for the statistical-rigor cross-asset negative result · transition-bronze for the week-one lessons forward horizon. Free to embed with attribution.

thorstenmeyerai.com

AI Trading Bot · Week 1 · The Win Rate Trap · paper trading research

21 STRATEGIES · 700+ TRADES · 1 CANDIDATE · 4 ASSETS · 5 LESSONS · NOT FINANCIAL ADVICE

Use Claude to Build an AI Trading Bot: 90 Days with Stocks and Prediction Markets (AI Trading Bot Series Book 1)

Use Claude to Build an AI Trading Bot: 90 Days with Stocks and Prediction Markets (AI Trading Bot Series Book 1)

As an affiliate, we earn on qualifying purchases.

As an affiliate, we earn on qualifying purchases.

Implications of Win Rate Versus Actual Profitability in AI Trading

This research underscores that a high win rate alone is not a reliable indicator of a profitable trading strategy. Many strategies that appear successful based on raw win percentages are actually taking advantage of market conditions or timing, rather than possessing genuine predictive edge. The findings highlight the importance of asymmetric payoff profiles and the need for extensive testing across different assets and market regimes to identify strategies with real, persistent edge. For traders and developers, this means focusing on the quality of decisions and payoff structures rather than superficial success metrics.

Early Challenges in Developing Consistent AI Trading Strategies

The experiment is part of ongoing efforts to understand whether AI can generate sustainable trading edge in highly efficient markets. Previous assumptions suggested that high win rates might correlate with profitability, but recent findings challenge this view. The researcher’s approach involves simulated trading in short-term binary markets, which are highly liquid and microstructured, providing a controlled environment for testing hypotheses. The initial results align with broader market research indicating that many seemingly successful strategies are often illusory or highly context-dependent.

"A high win rate, by itself, tells you almost nothing about whether a strategy has an edge. It reflects the types of trades being taken, not their quality."

— Researcher

Limitations of Current Results and Future Validation Needs

The sample size of several hundred trades is still too small to confidently confirm the presence of a persistent edge. Variance and chance can produce misleading results, and the model's performance on different assets varies significantly. Further testing over a larger number of trades and across diverse market conditions is required to establish the strategy’s robustness and potential for real-world application.

Next Steps in AI Trading Research and Strategy Validation

The researcher plans to run the most promising strategy variants over at least ten times the current number of trades to evaluate their stability and profitability. Additional testing across different market environments and assets will help determine whether any observed edge is genuine or a statistical artifact. Future publications will focus on sharing insights into the underlying model structures without revealing proprietary details, to prevent edge erosion.

Key Questions

Can a high win rate strategy still lose money?

Yes. High win rates often result from taking trades when the market already favors an outcome, which does not necessarily translate into profitability. The key is the payoff structure and whether wins outweigh losses in size and frequency.

Why is win rate alone not enough to judge a trading strategy?

Because it does not account for the size of wins versus losses or whether the strategy is taking advantage of market inefficiencies versus timing or market conditions.

What does the researcher mean by 'edge' in trading strategies?

Edge refers to a strategy's ability to generate consistent profits over time by having a predictive advantage that outweighs transaction costs and market randomness.

Will the researcher share the specific model details?

No. The researcher plans to keep proprietary aspects confidential to prevent others from copying potential edge strategies, focusing instead on general insights and future validation.

When will more definitive results be available?

After running significantly more trades over extended periods and across different assets, the researcher will assess whether the promising strategies demonstrate genuine, persistent edge.

Source: ThorstenMeyerAI.com

You May Also Like

Autonomous Wheelchair Uses AI to Maneuver Through Crowds

Discover how autonomous wheelchairs use AI to navigate crowds safely, adapting in real-time to keep users moving confidently and independently.

Dyslexia Support Tech: How Reading Tools Reduce Visual Stress

Supporting dyslexic readers with customizable tools can significantly reduce visual stress, but discovering how these features work may change your experience forever.

The Hidden Role of Large Print and High Contrast Hardware

Navigating technology becomes easier with large print and high contrast hardware, revealing how these tools transform accessibility—discover what you might be missing.